
2 / The Erosion of California’s Middle Class
Despite robust job growth over the past half-century, the average Californian has not benefited from the state’s thriving economy.
Since 1979, California has increased its total number of jobs by 174 percent. Growth in the quantity of jobs, however, does not tell the entire story of California’s economic and workforce health.
The majority of job growth in recent decades occurred in what we define as low-quality and high-quality jobs. In other words, California has done a very good job of creating high-quality jobs, has performed less well in preventing the growth of low-quality jobs, and has done poorly in creating middle-of-the-road jobs (see Figure 1).
The core takeaway from all of these indicators is that incomes and wages in California are on a trajectory of increasing polarization—a high proportion of workers earning low- and high-wages, with little growth in the wage percentiles that represent middle-class occupations.
Percent change (vs 1979) in real hourly wages

Figure 1. The 10th percentile represents the bottom 10 percent of wages in California, while the 90th percentile represents the top 10 percent of wages.
Source: UC Berkeley Labor Center, Low-Wage Work in California Data Explorer

While startling, these job quality and income data are not without optimistic counterparts. Growth in high-quality jobs outpaced growth in low-quality jobs, so the proportion of high-quality jobs relative to the total number of jobs is increasing.
Likewise, the state’s performance on per capita income has remained above the national average for decades: In 1958, California’s per capita personal income was around 125 percent of the national average; in 2020, it was about 118 percent of the national average.
Good performance on per capita income comes, of course, with the caveat that the cost-of-living is higher in California than other states in the country. But signs of promise and progress should be considered alongside the signs of struggle.


California is also making progress on economic issues that intersect with social safety and health. Just 7.7 percent of Californians lack health insurance, for example, owing to a robust Medicaid and Medicare expansion at the federal and state levels.
Furthermore, healthcare access expansion at the federal level did not have statistically-significant detrimental effects on the labor market, indicating that Americans continued working even as their healthcare decoupled from their employment. California’s labor force participation rate, as discussed later in this report, has shown signs of decline, but there is no indication that access to healthcare is a root cause.
Widely-used measures of poverty also demonstrate some progress. California’s poverty rate, in part due to the expansion of social safety net programs, has declined from 12.7 percent in 2000 to 11.8 percent in 2019—a hopeful sign given that the national poverty rate increased over the same period.
Wage and income polarization has nonetheless persisted in California, even as the state has made incremental progress in health care expansion and strengthening the social safety net. More work is needed to continue positive trends, reverse the trend of polarization, and revitalize the state’s middle class. We begin the process of targeting polarization’s root causes by identifying some of the phenomena that signal the growing distance between California’s top and lowest earners.


California is making progress on economic issues that intersect with social safety and health.

Decoupling wages and productivity
Contextualizing the polarization of jobs and wages requires assessing whether these poles developed in response to productivity trends. Employers, in other words, may be keeping wages low for a substantial portion of the workforce to accommodate downward trends in their productivity. Recent analysis from Bloomberg, though, shows that the last two and a half decades have seen a steady increase in revenue per employee in the state, maintaining a rate above the national average in the mid-2010s into the 2020s (see Figure 2).
Likewise, Bureau of Labor Statistics data indicates that between 2007 and 2017, California’s labor productivity growth was fourth-best in the U.S. at 1.7 percent, while real hourly compensation grew by just 0.8 percent, good for 12th best in the country. It appears that wages in California, then, are decoupled from productivity, and/or that productivity gains are being reinvested into the top end of the workforce (e.g., by the creation of “superstar” firms). The latter explanation aligns with observations of high-quality, high-wage job growth outpacing middle and low-quality jobs.


Additional research on the general trend of wage-productivity decoupling identifies technological development and globalization as other possible causes.
Technological innovation tends to be skill-biased, meaning that new production technologies increase the demand for educated, experienced labor over unskilled labor as cause and consequence of skilled workers’ technology-enabled productivity gains (and a greater share of work being done by technologies rather than low-skill labor).
The globalization argument for wage-productivity decoupling suggests that the availability of low-wage labor and inputs at the global scale produces cost and productivity benefits that do not translate into higher wages locally. In reality, “The Great Decoupling” in California and the U.S. is likely the result of a combination of factors.
No matter the cause of decoupling, it is essential to understand the additional factors that contribute to increasing polarization in the Californian job market. Causal mechanisms are difficult to test because each industry has its own sets of determining factors (e.g., labor markets, average profit margins, and regulatory environments). We can, however, assess some of the factors that are correlated with low and high wages to identify the levers policymakers and other stakeholders have available for narrowing income inequality and promoting a less polarized workforce.

Employers may be keeping wages low to accommodate downward trends in productivity.
California’s educational disparities lead to workforce and income disparities
The disparity between wages for college-educated workers and non-college-educated workers in California supports the above suggestion that productivity increases find their way to high-wage workers to the detriment of mid- and low-wage workers. College degree holders in California saw wages increase 30 percent since 1980 and non-degree holders saw a slight decrease, resulting in college degree holders earning $2.20 for every $1 that non-degree holders earn. Thus, education disparities provide further evidence of occupational polarization and lend insight into its causes.
The preference that employers have for paying college-educated workers more than workers without college degrees is evident in the composition of the most common high-earning jobs in California. Computer hardware engineers, compensation and benefit managers, professional medical workers (e.g. dentists, psychiatrists, and surgeons), financial managers, architectural and engineering managers, and information technology professionals rank among the highest-paid workers in the state. The lowest earners include frontline food service workers, merchandise handlers and shipping clerks (e.g., warehouse workers), agricultural graders and sorters, farmworkers, and frontline hospitality workers (e.g., hosts and ushers)—jobs that require little to no education.


California’s K-12 system is also a source of polarization, both in the state’s general performance against other states and in its specific curricula to prepare students for jobs of the future. In the general sense, research and the lived experiences of California’s families suggests that the 1978 passage of Proposition 13 was a watershed moment in the state’s K-12 spending. The proposition had the effect of shifting the source of education funds from local property taxes—at the time making up about 60 percent of education budgets—to the overall state budget. Prior to its passage, California spent more per pupil than the national average. By 1983, however, spending per pupil had dipped below the national average as state officials made cuts to balance state budgets. Outperformance of other states in per-pupil spending never returned, with California now ranked 41st in the U.S.
California’s cuts in education spending occurred just as the state’s K-12 student population was rapidly diversifying. A 2017 study by nonprofit GreatSchools found that in California, “Only 2 percent of African American students and 6 percent of Hispanic students attend a high performing and high opportunity school for their student group, compared with 59 percent of white and 73 percent of Asian students.”
Unequal access to high-quality K-12 education impacts under-resourced students’ ability to gain admission to the state’s and country’s premier higher education institutions (Figure 3); given that college education is a strong predictor of high wages in California, these disparities thus have enduring impacts on the job prospects of California’s most disadvantaged students and communities.
African American and Latino Students Have Lower Access to Classes That Grant Eligibility to the UC/CSU Systems

Figure 3.
Source: GreatSchools, May 2017

The relative decline in general education spending undoubtedly placed students at a disadvantage that likely carried over into their earning potential as adults. The situation has been aggravated by a lack of success in educating California’s students toward in-demand skills, particularly in computer science.
Take, for example, the state’s computer science offerings in public schools from a recent analysis by the Kapor Center: despite being a leader in technological innovation, California performs worse than the national average, with just 42 percent of high schools offering at least one computer science course compared to 47 percent nationally. The schools hardest hit by limited computer science offerings are those in low-income areas, those with high numbers of Black, Indigenous, Latino, and Pacific Islander populations and those in rural areas.
According to research, “Students in low-income communities were over two times less likely to have access to computer science courses than their counterparts in high income communities.”
Average weekly wage by county, fourth quarter 2020
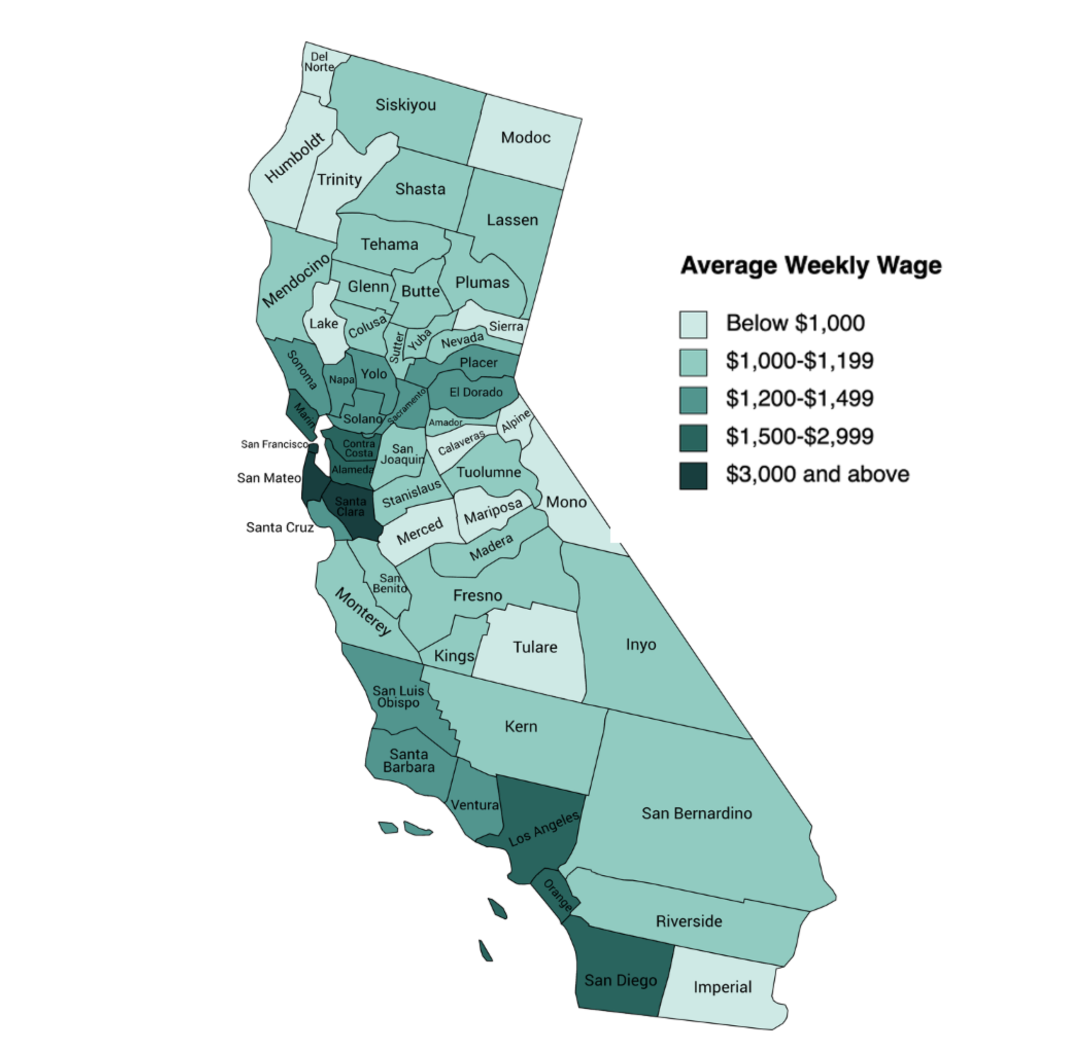
Figure 4.
Geographic disparities in jobs and wages
Collective action at the state level has perhaps been difficult to achieve because of a practical reality: California is the third largest state by total area in the nation. Accordingly, local economies drastically differ by region.
This geographic diversity provides both data to substantiate the polarization of jobs and wages in the state and a target for identifying polarization’s root causes. Aligning with common refrains about the “coastal elite,” wage and income data suggest that high-wage jobs do tend to be concentrated in coastal metropolitan areas and low-wage jobs tend to be concentrated inland (see Figure 4).

In California, high-wage jobs tend to be in coastal metropolitan areas while low-wage work is concentrated inland.
The Bay Area, for example, has the lowest percentage of workers earning less than $15 per hour, due at least in part to the rapid growth of the technology industry. Workers in Fresno, just a few hours’ drive from the Bay Area, suffer from the highest percentage of workers with low wages—40 percent earn less than $15 an hour, likely due to the concentration of agriculture and e-commerce jobs that have characterized the economy in recent decades.
We can find similar—and stark—gaps in wages between coastal Los Angeles and the Inland Empire and between San Diego and Imperial County.
Finally, regions where agriculture, logging, mining, and other local sources of revenue have declined suffer even more from regional disparities in wages than regions that have managed to maintain these outputs or have successfully diversified their local economy.
Lower cost of living in the inland areas compared to coastal areas helps to make up some of the wage differences, but state-specific poverty tools like the California Poverty Measure suggest that some areas remain in a disadvantageous position even when cost of living is factored out.
The unequal geographic distribution of wages is therefore a pressing issue in need of creative solutions. Geographic disparities are not only critical to address because of the wages themselves, but also because of the divergent characteristics in the mix of jobs in each area.
The San Joaquin valley, for example, is home to oil fields, farms, prisons, and warehouses. Workers in entry-level positions in these industries may have less of an internal ladder to climb. Likewise, workers cannot readily transition to careers in industries with higher quantities of well-paying jobs, such as technology or finance centers in the Bay Area and Los Angeles, without uprooting their families and other aspects of their lives, such as finding housing or transferring children’s schools.
In other words, California’s geographic diversity of jobs reduces workers’ ability to easily transition into industries with higher-earning occupations, exacerbating polarization. As Figure 5 shows (below), these disparities also impact the poverty rates of different demographic communities. Specifically, Latino and Black Californians experience substantially higher poverty rates than white Californians.
Latinos have the highest poverty rates in California

Figure 5. Most categories show responses about race from the American Community Survey. People of any race who report Hispanic, Latino, or Spanish origin are defined as Latino and categorized by their responses to that question.
Source: California Poverty Measure, 2019
The polarization of jobs and wages is perhaps most evident in the number of Californians who report living in poverty while holding jobs. According to the California Future of Work Commission (2021), “nearly 45 percent of 7 million Californians living in poverty reported living in a family with at least one family member working full-time.”
Working poverty is a difficult issue to address via traditional mechanisms because of the limitations on working people’s time and energy.
Higher education, for example, is further out of reach for the working poor than those without jobs even when financial assistance is readily available. Californians working in poverty therefore rely upon large social safety net programs to meet basic needs. The Public Policy Institute of California (2020) estimated that without these programs, 6.6 percent more Californians would live in poverty.
Various social safety net programs have been effective in combating working poverty. The federal Earned Income Tax Credit and Child Tax Credit combined with state programs such as CalFresh, CalWORKs, California Earned Income Tax Credit (EITC), the Young Child Tax Credit, and General Assistance lowered poverty by over 5 percentage points.
The effects of these programs are largest in the most impoverished regions of California, such as the inland regions and the Sierras. It stands to reason, then, that social safety net programs should be regionally targeted to reduce poverty.
Addressing working poverty and poverty in general will be central to the state’s efforts to create equal opportunities and outcomes for racial and ethnic demographic groups. Twenty-one percent of Latino Californians, 17.4 percent of African American/Black Californians, and 14.5 percent of Asian American/Pacific Islander Californians experience poverty compared to 12.1 percent of white Californians.
And while California has long prided itself on welcoming immigrants, poverty rates among those moving here is much higher than average: 21.6 percent of immigrants are in poverty compared to 14.4 percent for non-immigrants, with the number jumping to 35.7 percent for undocumented Californians.